Quantitative Techniques | Definition, Application, Importance & Limitations

QUANTITATIVE TECHNIQUES


WHAT IS QUANTITATIVE TECHNIQUES ?


Decision Science is the application that uses scientific approach and solves the management problems. It also helps managers to make best decisions. Decision science includes a large number of mathematically oriented techniques. These techniques can be either developed within field of decision science or taken from other disciplines. Decision science is a recognized and established discipline in business. Decision science is a technique which is mainly used within business for increasing their efficiency and productivity.

In various surveys of businesses, many indicate that they use decision science techniques, and most rate the results to be very good.
Decision science is also known as operations research, quantitative techniques, quantitative analysis and management sciences. It is largely used in daily routine of most programs of business organization.

Contents :

  1. Meaning & Definition of Quantitative Techniques.
  2. Role of Quantitative Techniques in Decision Making.
  3. Characteristics of Quantitative Techniques.
  4. Scope of Quantitative Techniques.
  5. Nature of Quantitative Techniques.
  6. Importance of Decision Science / Quantitative Techniques.
  7. Limitations of Quantitative Techniques in Business Decision Making.
  8. Applications of Quantitative Techniques.


Meaning and Definition of Quantitative Techniques :


The term Decision Science / Quantitative Techniques (QT) /Operations Research (OR) describes the discipline that is focused on the application of Information Technology (IT) for well-versed decision-making.

Quantitative techniques are those statistical and programming techniques: which support the decision making process especially related to industry and business. QT takes into consideration the elements of qualities such as use of numbers, symbols and other mathematical expressions. QT is basically helpful enhancement to judgment and intuition. Quantitative techniques assess planning factors and alternatives as and when they arise rather than suggest courses of action.

Quantitative, techniques may be defined as those techniques which provide the decision maker with a systematic and powerful means of analysis and help, based on quantifiable data, in exploring policies for achieving pre-determined goals. ”Quantitative techniques are mainly appropriate to problems of complex business enterprises”.

QT can be considered as the scientific approach to managerial decision making. This approach starts from raw data and after manipulation or processing, information is produced which is valuable for making decision.
The main aim of quantitative analysis is the processing and manipulating of raw data into meaningful information. For increasing the use of quantitative analysis, computer can be used as an instrument.

According to C.R. Kothari :
“Quantitative Techniques may be defined as those technique which provide the decision maker with a systematic and powerful means of analysis and help, based on quantitative in exploring policies for achieving per-determined goals”.
Quantitative Techniques are the devices developed on the basis of mathematical and statistical models.

Role of Quantitative Techniques in Decision Making :

The major roles of quantitative technique are as follows :
  1. It provides a tool for scientific analysis.
  2. It offers solutions for various business problems.
  3. It enables proper deployment of resources.
  4. It supports in minimizing waiting and servicing costs.
  5. It helps the management to decide when to buy and what is the procedure of buying.
  6. It helps in reducing the total processing time necessary for performing a set of jobs.


Characteristics of Quantitative Techniques :
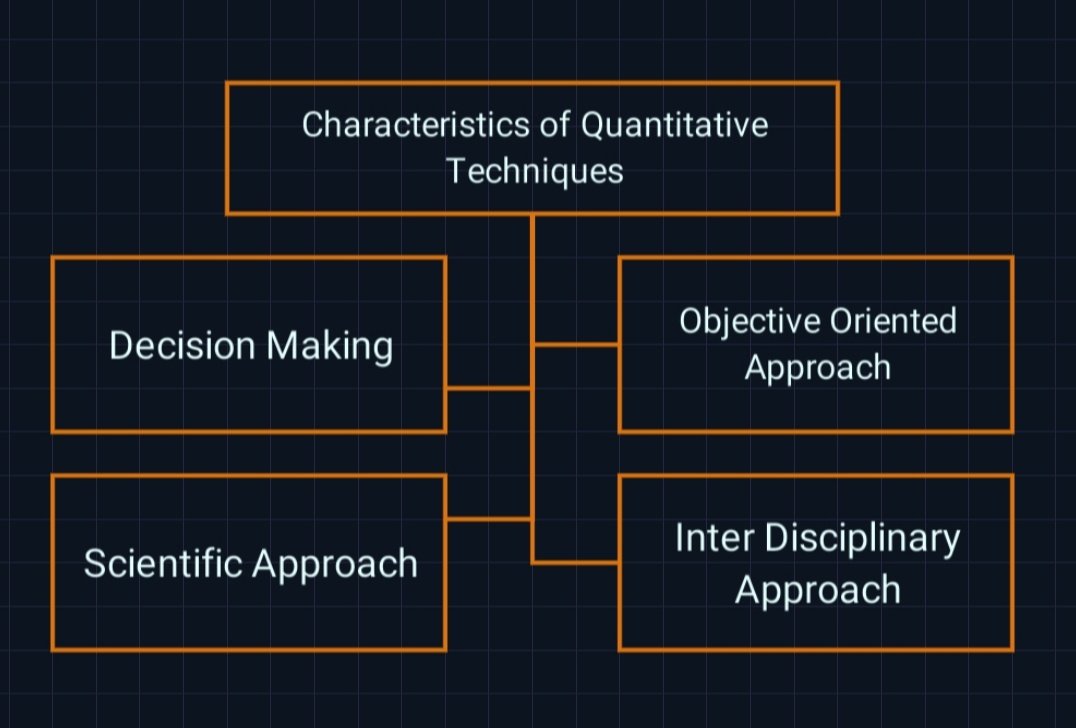


1) Decision-Making : 
Decision-making or problem solving constitutes the major working of operations research: Managerial decision-making is considered to be a general systematic process of operations research (OR).

2) Scientific Approach : 
Like any other research,  operations research also emphasizes on the overall approach and takes into account all the significant effects of the system. It understands and evaluates them as a whole. It takes a scientific approach towards reasoning. It involves the methods defining the problem, its formulation, testing and analyzing of the results obtained.

3) Objective-Oriented Approach :
Operations Research not only takes the overall view of the problem, but also endeavor’s to arrive at the best possible (say optimal) solution to the problem in hand. It takes an objective-oriented approach. To achieve this, it is necessary to have a defined measure of effectiveness which is based on the goals of the organization. This measure is then used to make a comparison between alternative solutions to the problem and adopt the best one.

4) Inter-Disciplinary Approach : 
No approach can be effective, if taken singly. OR is also inter-disciplinary in nature. Problems are multi-dimensional and approach needs a team work. For example, managerial problems are affected by economic, sociological, biological, psychological, physical and engineering aspect. A team that plans to arrive at a solution, to such a problem, needs people who are specialists in areas such as mathematics, engineering, economics, statistics, management, etc.

Network Analysis – Objectives,Techniques, Drawing Network

Contents :

  1. Concept of Network Analysis.
  2. Objectives of Network Analysis.
  3. Advantages of Network Analysis.
  4. Disadvantages of Network Analysis.
  5. Techniques for Network Analysis.
  6. Networking Components.
  7. Precedence Relationship.
  8. AOA and AON Approaches for Several Commonly Encountered Activity Relationship.
  9. Drawing Network.
  10. Rules for Drawing Network Diagram.
  11. Common Errors and Dummies in Network.

What is Network Analysis ?


project network for reliable construction co. project
Graphic representation of a project’s operations is called a network. It is the combination of activities and events which are require to reach the end objective of a project.
Various activities are performed at the same time and there are various activities which can be started only at the completion of other activities in a big project. The main work for detailed study of the product is to determine the information about the project and then discover a new, better and quicker way to get the work done. Thus thorough study of project is done through some suitable diagram which shows various activities and their positions in the project. It is also helpful to know that in what way the delay in any activity can affect the whole project in terms of time and money. A number of nodes (typically shown as small circles or rectangles) and a number of arcs (shown as arrows) that connect two different nodes exist in a project network (figure).
Network analysis involves a group of techniques which are used for presenting information about the time and resources involved in the project so as to assist in the planning, scheduling and controlling of the project. The information usually represented by a network includes the sequences, interdependencies, interrelationships and critical activity of various activities of the project.


Objectives of Network Analysis :


1) Minimize Production Delay, Interruptions and Conflicts : 
This is achieved by identifying all activities involved in the project, their precedence constraints, etc.

2) Minimization of Total Project Cost : 
After calculating the total cost of the project the next step is to minimize the total cost. It is done through the calculation of cost of delay in the completion of an activity of the project and calculating the cost of the resources which are required to complete the project in a given time period.

3) Trade-off between Time and Cost of Project : 
The duration of same activity can be reduced if additional sources are employed and this is the main idea on which the trade-off between time and cost of project is based. Due to technical reasons, the duration can be reduced in a specific limit. Similarly, there is also a most cost efficient duration called ‘normal point’ stretching the activity beyond it may lead to a rise in direct cost.

4) Minimization of Total Project Duration : 
After checking the actual performance against the plan the project duration can be controlled and minimized. If any major difference is found then apply the necessary reschedule process by updating and revising the uncompleted portion of the project.

5) Minimization of Idle Resources : 
If there is any variation in the use of scars resources then it can disturb the entire plan and hence it is required that efforts should be made to avoid any increase in cost due to idle resources.

Advantages of Network Analysis :


  1. For planning, scheduling and controlling of operations in large and complicated projects network analysis is very important and powerful tool.
  2. For evaluating the performance level of actual performance in comparison to planned target network analysis is a very useful tool.
  3. With the use of network analysis technological interdependence of different activities can be determined for proper integration and co-ordination of various operations.
  4. Network analysis gives the proper co-ordination and communication between various parts of the project.
  5. Network analysis deals with the time-cost trade-off and provides the optimum schedule of the project.
  6. This technique is very simple and suitable for the computer users.


Disadvantages of Network Analysis :


  1. Network construction of complex project is very difficult and time consuming in network analysis.
  2. Actual time estimation of various activities is a difficult exercise.
  3. Analysis of the project is a very difficult work because a number of resource constraints exist in the project.
  4. In many situations time-cost trade off procedure is complicated.


Simulation – Types, Benefits, Limitations, Models, Phases

Simulation


What is Simulation ? 


Meaning and Definition of Simulation :

A simulated model may be defined as one which depicts the working of a large scale system of man, machines, materials and information operating over a period of time in a simulated environment of the real world conditions.
Simulation is a numerical solution method that seeks optimal alternatives (strategies) through a trial and error process. The simulation approach can be used too study almost any problem that involves uncertainty, i.e., one or more decision variables can be represented a probability distribution, like decision making under risk.

According to Shannon :
“Simulation is the process of designing a model of a real system and conducting experiments with this model for the purpose of understanding the behavior (with the limits imposed by a criterion or set of criteria) for the operation of the system”.

According to Levin & Kirk Patrick :
“Simulation is an appropriate substitute for mathematical evaluation of a model in many situations. Although it too involves assumptions, they are manageable. The use of simulation enables us to provide insights into certain management problem where mathematical evaluation of a model is not possible.”


Contents :                               

  1. Meaning and Definition of Simulation.
  2. Scope of Simulation Techniques.
  3. Phases of Simulation.
  4. Application of Simulation.
  5. Types of Simulation.
  6. Models of Simulation.
  7. Benefits of Simulation.
  8. Limitations of Simulation.
  9. Monte Carlo Simulation Procedure.
  10. Random Digits and Methods of Generating Probability Distribution : Example.


Scope of Simulation Techniques :


Scope of Simulation in different area is as follows :

1) Healthcare (Clinical) Simulators : 
Medical health simulators are developed and deployed to teach healing and diagnostic procedures. It is also used to teach medical concepts and decision making to personnel who are involved in the professions.

2) Computer Simulators : 
Simulators have been proposed as an ideal tool for assessment of students for clinical skills. Programmed patients and simulated clinical situations, including mock disaster drills, have been used extensively for education and evaluation. These “lifelike” simulations are expensive, and lack reproducibility. A fully functional “3Pi” simulator would be the most specific tool available for teaching and measurement of clinical skills. Such a simulator meets the goals of an objective and standardized examination for clinical competence. This system is superior to examinations that use “standard patients because it permits the quantitative measurement or competence, as well as reproducing the same objective findings.

3) Military Simulations : 
Military simulations are e models in which theories of warfare can be tested and advanced without the need for actual hostilities. It is also known as war games. They exist in different forms with various degree of realism.

4) Finance Simulations :
In financing computer simulation are often used for scenario planning.

5) Flight Simulators : 
A flight simulator is used for the training of the pilots on the ground. A pilot gets permission by this technique to crash his simulated “aircraft” without being hurt. Pilots are trained with the use of flight simulators to operate aircraft in extremely dangerous situations, such as landing with no engines, or complete electrical or hydraulic failures. High-fidelity visual systems and hydraulic motion systems are included in most advanced simulators. The simulator is normally cheaper to operate than a real trainer aircraft.

6) Engineering, Technology or Process Simulation :
Simulation is an important feature in engineering systems or any system that involves many processes, For example, in electrical engineering, delay lines may be used to simulate propagation delay and phase shift caused by an actual transmission line. Similarly, dummy loads may be used to simulate impedance without simulating propagation, and is used in situations where propagation is unwanted. A simulator may imitate only a few of the operations and functions of the unit it simulates.

Phases of Simulation :


Step 1: Identify the Problem : 
If an inventory system is being simulated, then the problem may concern the determination of the size of order (number of units to be ordered) when inventory level falls up to recorder level (point).

Step 2 : i) Identify the Decision Variables
ii) Decide the Performance Criterion (Objective) & Decision Rules
For example, demand (consumption rate), lead time and safety stock are identified as decision variables in inventory problem. These variables shall be liable to measure the performance of the system in terms of total inventory cost under the decision rule – when to order.

Step 3 : Construct a Numerical Model : 
Construct a model which is possible to be analysed on the computer. Sometimes the model is written in a specific simulation language which is suitable for the given problem under analysis.

Step 4 : Validate the Model :
It is ensuring that the model should be representing the system truly which is analysed and the result will be reliable.

Step 5 : Design the Experiments : 
Design the experiments with the, help of simulation model by listing particular values of variables to be tested (i.e. list of courses of action for testing) at each trial (run).

Step 6 : Run Simulation Model : 
For obtaining the results in the form of operating characteristics run the model on the computer.

Step 7 : Examine the Results in Terms of Problem Solution : 
Results are examined as well as their reliability and correctness. Best course of action is selected after completing the simulation process otherwise desired changes are done in model decision variables parameters or design, and return to step 3.

Markov Chain Analysis | Properties, Assumptions, Classification & State Transition Matrix

What is Markov Chain Analysis ? Markov Analysis is a way of analyzing the current movement of some variable in an effort to forecast its future movement. As a management tool, Markov analysis has been used during the last several years, mainly as a marketing aid for examining and predicting the behavior of customers from the standpoint … Read more

Probability – Rules, Types, Application, Uses, Characteristics

Probability


What is Probability ?


Computation of the chance of an occurrence of a certain event is called probability. Hence, probability is the study of random happening of an event and uncertainty, e.g. “Probability of rain tomorrow is only 35%”, and “Probability of winning a lottery is 1 out of 40,406,353”.
Before conducting an experiment, the absolute certainty of the outcome is unpredictable, therefore it is termed as probability, which actually depends on the idea of a random experiment’.
The theory of probability originates from the ‘game of chance’ associated with gambling, e.g., consider a game like gambling, tossing of a coin, throwing of a die, and random drawing of cards from a pack of cards. Thus, in statistics, probability (of an event) is defined as the ‘proportion of time’ in which an event occurs and is observed, even if the experiment is run an infinite number of times.

Contents :  

  1. Meaning and Definition of Probability.
  2. General Rule for Probability.
  3. Application of Probability.
  4. Characteristics of Probability Function P(A).
  5. Uses of Probability in Decision Making.
  6. Types of Probability : Objective Probability & Subjective Probability Theory.


Meaning and Definition of Probability :


Probability is the mode of expression of knowledge or belief whether the event has occured or will occur. Thus, in the theory of probability this concept has been given an exact mathematical significance for being used widely in such areas of study as mathematics, statistics, finance, gambling, science, and philosophy, so that conclusions can be drawn regarding the probability of potential events and the mechanics of complex systems being hidden.

According to Levin :
“We live in a world in which we are unable to forecast the future with complete certainty. Our need to cope with uncertainty leads us to the study and use of probability theory“.

According to American Heritage Dictionary :
“Probability is the branch of mathematics that studies the likelihood of occurrence of random events in order to predict the behavior of a defined system”.

General Rule for Probability :


The probability of an event (say A) is defined as follows :

If an event happens m times and it fails n times, then the probability (p) of event A is defined as :
              m
P(A) = ——–
            m+n

        The number of cases favorable to
         the occurence of the event
P(A) = ————————————————
        Total number of mutually exclusive
         and exhaustive cases

So the total number of trials favorable to the event (A) divided by the total number of ways in which the event (A) can happen.

         The number of cases favorable to 
           the occurence of the event
P(A) = ————————————————-
       Total number of mutually exclusive
         and exhaustive cases

Probability in favor of the occurrence of the event :

        The number of cases favorable to
m      the occurence of the event
— = —————————————————
n     The number of cases against
         the occurrence of the event

Probability against the occurrence of the event :
        The number of cases against 
n      the occurence of the event
— = ————————————————
m     The number of cases favorable to
         the occurrence of the event

Applications of Probability :


  1. It plays a great role in making predictions.
  2. It is used to solve scientific investigations as well as day-to-day problems.
  3. It is very useful when one wants to predict the uncertainties of betting.and chances of success.
  4. It is extensively used in business and economics.
  5. It is the basis of the law of statistical regularity and law of inertia of a large number.


Characteristics of Probability Function P(A) :


  1. The limit of probability of an event A is between 0 and 1, i.e. 0<P(A)<1.
  2. When probability of two events A and B which are mutually exclusive, is combined, the probability is the sum of individual probabilities of A and B, i.e., P(AOB) will be P (A) + P (B).
  3. Two events which are equivalent are assigned the same probability.

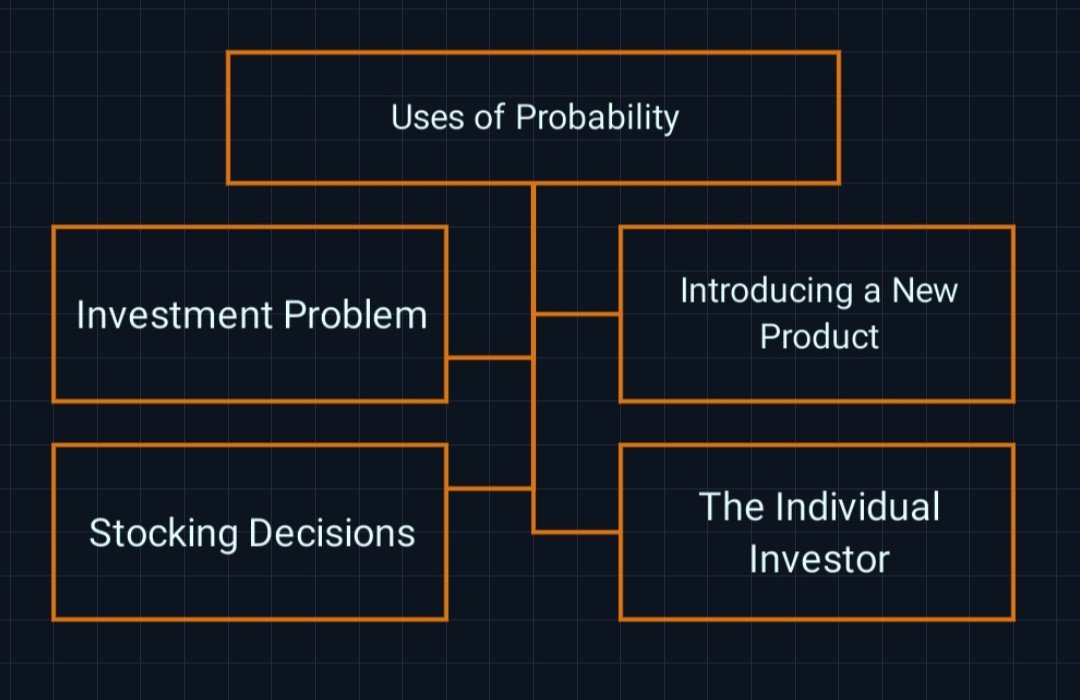
Uses of Probability in Decision-Making :


Following are the business situations where managers use probability to take a decision :

1) Investment Problem : 
A company’s manager has two different projects (with different initial costs) for investment. The decision taken by the manager is based on the choice that the outcome of which is dependent on the level of demand.

2) Introducing a New Product : 
While introducing a new product there arises a problem in deciding about the introduction of the product. The decision maker is not sure whether the product would be acceptable or not. Hence after conducting test, marketing in three different regions the results being contradictory, the idea of introducing a new product should be dropped ? Thus, it is necessary to answer this question : what would be the chances of success of introducing a new product ?.

3) Stocking Decisions :
The demand of a perishable commodity is unknown to its dealer in advance. Thus if the commodity is not sold by the end of the day it will be spoiled. Therefore, he is not sure about the demand pattern and stock amount (that how much commodity is to be stored in advance).

4) The Individual Investor : 
Maximisatiorn of returns is the motive of investors who are engaged in buying and selling of equities. The behavior of equities/ security prices is uncertain and it depends upon various factors. In this situation, managers take decisions on the basis of their prediction about future prices of the securities. This prediction helps the investor to take a decision as to which.securities he/she should select for the investment.

Quantitative Data | Types, Examples, Methods, Uses & Importance

✏ Table of Content : Introduction to Quantitative Data Examples of Quantitative Data Characteristics of Quantitative Data Collection Methods of Quantitative Data Analysis Methods of Quantitative Data Types of Quantitative Data Importance of Quantitative Data Limitations of Quantitative Data Qualitative vs Quantitative Data Quantitative data provides a systematic and rigorous approach to understanding and analyzing … Read more

Qualitative Data | Types, Examples, Methods, Uses & Importance

✏ Table of Content : Introduction to Qualitative Data Uses of Qualitative Data Characteristics of Qualitative Data Examples of Qualitative Data Types of Qualitative Data Methods of Qualitative Data Analysis Importance of Qualitative Data Limitations of Qualitative Data How to Analyze Qualitative Data ? Qualitative data plays a crucial role in enriching our understanding of human … Read more